A quarterly business review, at its core, is a strategic huddle held every three months. It’s where your go-to-market teams check performance against goals, pinpoint operational friction, and align on a unified plan for the next push. When executed through a RevOps lens, it’s not just a status update; it becomes a powerful planning session that sharpens your GTM strategy and drives predictable growth.
Why Your QBR Needs a RevOps-Driven Overhaul

Let's be honest—most QBRs feel more like a chore than an opportunity. They often devolve into a backward-looking exercise where each department presents its own version of the truth. Marketing talks lead volume from HubSpot, sales reports on closed deals from Sales Cloud, and customer success discusses churn from Service Cloud, but no one connects the dots across the entire revenue engine.
This siloed approach creates familiar frustrations: misaligned priorities, budget wasted on campaigns that don't convert, and stalled growth. The core issue is that traditional QBRs focus on what happened, but they lack the unified data story to explain why it happened across the entire customer lifecycle.
The Shift to a Strategic Mindset
A RevOps-driven quarterly business review completely flips the script. It stops being a series of departmental reports and becomes the central nervous system for your entire go-to-market strategy. By breaking down the walls between platforms like Salesforce and HubSpot, Revenue Operations builds a single source of truth that tells the full story of the customer journey. You can dig deeper into this concept in our guide explaining what Revenue Operations is and why it matters.
This change moves the conversation from isolated metrics to shared outcomes. It’s no longer about marketing hitting its MQL target or sales meeting a quota; it’s about aligning all teams to optimize the entire revenue engine.
The goal is to transform your QBR from a rearview mirror into a GPS. It should leverage historical data from your CRM and marketing automation platform to diagnose root causes and chart a clear, data-backed course for the next 90 days.
This unified perspective is essential for building sustainable growth. A RevOps framework brings the discipline of a system audit to your QBR, using your Salesforce or HubSpot data to reveal critical process gaps and data hygiene issues that are throttling revenue potential. By bringing this structured approach to your QBR, you turn it into a proactive tool that aligns every team around one mission: driving predictable growth.
Shifting from a Traditional QBR to a RevOps-Focused QBR
Adopting a RevOps mindset means more than changing a few slides in your presentation; it's a fundamental shift in how you approach the QBR process. It moves the focus from departmental performance to the health of the entire revenue funnel.
| Element | Traditional QBR Approach | RevOps-Focused QBR Approach |
|---|---|---|
| Focus | Departmental KPIs (e.g., MQLs, Demos Booked, Deals Closed) | End-to-end revenue lifecycle metrics (e.g., CAC, LTV, conversion rates) |
| Data Source | Siloed reports from Marketing, Sales, and CS platforms | A single, unified source of truth from an integrated tech stack (e.g., Salesforce, HubSpot) |
| Conversation | "What did your team accomplish?" | "How did our GTM motion perform and what's the root cause?" |
| Objective | Report on past performance | Diagnose system issues, forecast accurately, and align on future strategy |
| Outcome | Finger-pointing and defending individual metrics | Cross-functional accountability and a shared action plan for tech and process improvements |
Ultimately, the RevOps-focused QBR creates a collaborative environment where every stakeholder understands how their work impacts the bottom line, leading to smarter, more unified decisions for the quarter ahead.
Laying the Groundwork for a Data-Driven QBR

An impactful quarterly business review doesn't just happen. It's the result of meticulous preparation, and it all starts with your data. The entire QBR hinges on a solid foundation of clean, trusted numbers pulled directly from your core systems.
Get this part wrong, and you'll spend the whole meeting debating the accuracy of a report instead of strategizing how to grow the business. It’s a classic pitfall that undermines credibility.
The first task is to define the purpose. What questions are you trying to answer? Perhaps you need to diagnose why pipeline velocity has stalled in Sales Cloud. Or maybe you need to prove the ROI of a specific campaign run through HubSpot. Defining these goals upfront aligns stakeholders and ensures every piece of data you pull has a clear, strategic purpose. This focus helps you avoid the "data dump"—an endless slide deck packed with charts that look impressive but don't tell a coherent story.
Unifying Your Data Sources
For most B2B companies, the complete revenue story is split across different systems. Marketing lives in platforms like HubSpot or Account Engagement (formerly Pardot), while the sales team operates entirely out of Salesforce Sales Cloud. A successful QBR requires a unified view, which means getting these systems talking to each other seamlessly.
This isn't just about exporting CSVs. To do it right, you need to leverage native connectors or integration platforms to create a single source of truth within your CRM. For example, by connecting HubSpot marketing campaign data directly to Salesforce opportunities, you can finally trace the journey from first touchpoint to closed-won, all in one place.
Here’s what that data consolidation process looks like:
- Map the Data Flow: Document how lead, contact, and account data moves between your marketing automation platform and CRM, identifying key sync points.
- Validate Key Fields: Ensure critical fields—like "Lead Source," "Campaign ID," and lifecycle stages—are standardized and consistently populated in both systems.
- Create Unified Reports: Build dashboards directly within your CRM (e.g., Salesforce) that pull in marketing engagement data. This gives everyone a holistic view of the funnel without toggling between platforms.
The Pre-QBR Data Audit
Before presenting a single number to the leadership team, you must stand behind its accuracy. A pre-QBR data audit is non-negotiable. It's an essential system check-up to find and fix the data integrity issues that can derail a strategic conversation.
Think of this audit as a stress test for your revenue engine. It's your chance to proactively find and fix the data discrepancies and process gaps that could undermine your credibility and send the QBR off the rails.
Focus your audit on these common problem areas:
- CRM Hygiene: Hunt down duplicate records, contacts with missing key information, and stale opportunities that are inflating your pipeline.
- Attribution Gaps: Verify that your attribution model is correctly capturing and assigning credit to all marketing touchpoints along the buyer's journey within Salesforce and your marketing platform.
- Lead Management Leaks: Audit your lead routing rules and sales follow-up SLAs. Are high-value leads slipping through the cracks due to a broken process or technical glitch?
This is the same discipline we apply during a full system audit, but focused on the metrics that matter for your QBR. By dedicating time to this groundwork, you ensure the quarterly business review is built on a bedrock of trusted data. This elevates the conversation from questioning the numbers to making decisive, forward-looking plans that move the needle. For a deeper dive, our guide on data governance best practices offers more strategies for maintaining a clean and reliable dataset.
Weaving Your Data into a Compelling QBR Story

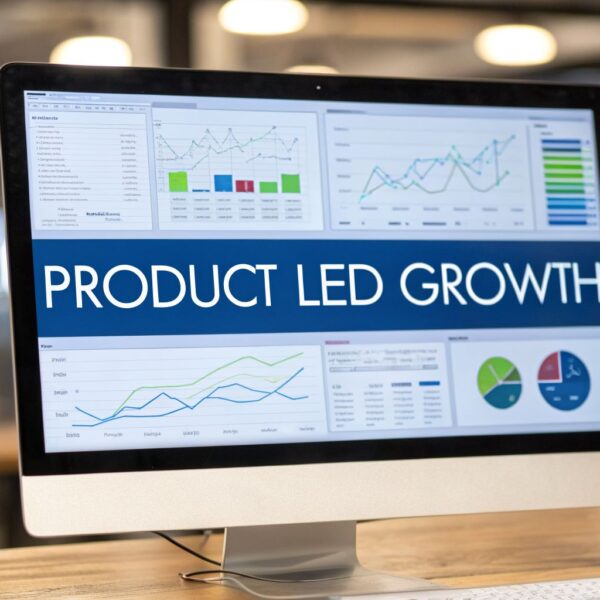
A dashboard like this is a great starting point, offering a snapshot of pipeline health, team activities, and conversion rates. But an effective QBR goes beyond presenting data; it uses that data to tell a compelling story about what’s working, what isn’t, and most importantly, why.
As a RevOps professional, you are the storyteller. Raw numbers from Salesforce and HubSpot are just plot points. Your job is to arrange them into a narrative that connects the dots from a marketing initiative to a revenue outcome. Forget cherry-picking vanity metrics. The goal is to demonstrate a deep, holistic understanding of the entire revenue engine by translating complex datasets into a clear story of cause and effect.
Frame Your Narrative Around the Full Funnel
A powerful QBR story flows logically through the revenue funnel. When you present metrics this way, you show how performance at each stage directly influences the next. This simple shift completely changes the conversation from departmental stats to strategic, cross-functional questions. The focus moves from "Did we hit our MQL target?" to "How effectively did our marketing spend translate into real pipeline and revenue?"
Structure your QBR dashboard and narrative around these three core stages:
- Top of Funnel (Demand Generation): Focus on the quality and velocity of new leads entering the pipeline from platforms like HubSpot or Account Engagement.
- Middle of Funnel (Pipeline Creation): Analyze how effectively marketing and sales collaborate to convert initial interest into qualified opportunities within Salesforce.
- Bottom of Funnel (Revenue Conversion): Scrutinize sales effectiveness, deal velocity, and win rates to understand how efficiently you are closing business.
The most insightful QBRs don't just report on metrics; they diagnose the health of the connections between each stage. A sudden drop in your win rate might not be a sales coaching issue—it could be a lead quality problem rooted in a top-of-funnel campaign.
This level of analysis is what separates a good QBR from a great one. You must audit everything from attribution models in your CRM to automation workflows in your marketing platform to ensure your go-to-market engine is resilient and optimized.
Connect the Dots from HubSpot to Salesforce
The real magic happens when you draw a straight line from marketing activities to revenue outcomes. This is where the tight integration between your marketing automation platform and CRM becomes your most valuable asset. Your Salesforce reports should pull in campaign data from HubSpot or Account Engagement to prove the ROI of every initiative.
Here’s a practical example of how this plays out:
- Start in HubSpot/Account Engagement: Your team launched a major webinar last quarter. You can see strong attendance and engagement metrics within the platform.
- Trace the Journey to Salesforce: Using proper campaign attribution, track exactly how many leads from that webinar converted into contacts and, more importantly, how many created opportunities in Sales Cloud.
- Analyze the Business Impact: Measure the pipeline value, win rate, and average deal size specifically for opportunities influenced by that webinar campaign.
Now you have a story that executives understand: "Our Q2 webinar didn't just generate 500 MQLs; it created $750k in new pipeline. Furthermore, those deals have a 28% win rate—5% higher than our company average. This data indicates the webinar attracted high-intent prospects who are more likely to buy."
To visually highlight trends or outliers in your data story, a tool like a box and whisker plot maker can be surprisingly effective. And if you need a refresher on which numbers matter most, review these essential sales performance metrics every RevOps leader should track.
Essential RevOps Metrics for Your QBR Dashboard
Building a dashboard that tells a clear story means selecting metrics that measure not just volume, but also efficiency, velocity, and conversion. Here are a few must-have metrics for any RevOps-led QBR, showing what they measure and where you'll find the data.
| Metric | What It Measures | Primary Data Source |
|---|---|---|
| MQL to SQL Conversion Rate | The percentage of marketing-qualified leads that sales accepts as sales-qualified. A key indicator of lead quality and marketing-sales alignment. | Salesforce & HubSpot/Pardot |
| Sales Cycle Length | The average time it takes to close a deal from opportunity creation to closed-won. It reveals sales process efficiency and potential bottlenecks in Sales Cloud. | Salesforce |
| Pipeline Velocity | How quickly opportunities are moving through your sales pipeline and generating revenue. It combines opportunity count, deal size, win rate, and sales cycle length. | Salesforce |
| Customer Acquisition Cost (CAC) | The total cost of sales and marketing efforts required to acquire a new customer. Essential for measuring the efficiency of your GTM strategy. | Salesforce & Financial System |
| Win Rate by Source | The percentage of closed opportunities won, segmented by their original lead source (e.g., organic, webinar, outbound). This proves which channels deliver the most valuable leads. | Salesforce |
By focusing on these connected, full-funnel metrics, your QBR becomes a forward-looking diagnostic tool, setting the stage for a strategic, data-informed plan for the quarter ahead.
Running a High-Impact QBR Meeting That Drives Action
All the data unification and narrative building leads to this moment: the QBR itself. A high-impact quarterly business review feels less like a presentation and more like a hands-on workshop. As a RevOps leader, your role is to guide a strategic conversation that digs into root causes and drives commitment to action.
The goal is to get past simply reporting on what happened. You need to foster an environment where sales, marketing, and customer success leaders can dissect performance, challenge assumptions, and agree on a unified plan. It's your responsibility to steer the conversation away from departmental blame and toward collaborative problem-solving.
A Model Agenda That Balances Past and Future
Many QBRs get stuck in the past, spending 80% of the time looking backward and leaving little room for forward-looking strategy. Your agenda must be intentionally designed to avoid this trap. A solid structure ensures all crucial topics get the attention they deserve, from celebrating wins to confronting bottlenecks in your Salesforce or HubSpot processes.
Here’s a practical framework to keep the discussion balanced and productive:
- Quarterly Highlights (15%): Kick off on a positive note. Briefly cover the top three wins from the last quarter, connecting them directly to revenue. This sets a collaborative tone.
- Performance Deep Dive (35%): Present your data story. Walk through the full-funnel metrics, showing how marketing programs influenced sales outcomes. This is also the time to analyze losses and pinpoint underperforming areas with data.
- Strategic Planning & Brainstorming (40%): This is the core of the meeting. Use the data as a foundation to discuss priorities for the next 90 days. The "start, stop, continue" framework can be highly effective here.
- Action Items & Ownership (10%): Before anyone leaves, summarize the key decisions. Every action item must have a clear owner and a firm deadline to ensure accountability.
Battle-Tested Facilitation Tips for RevOps Leaders
Running a QBR with strong leaders from different departments requires finesse. Your ability to guide the conversation is as critical as the data you present. Think of yourself as the impartial moderator whose only loyalty is to the health of the entire revenue engine.
Disagreements will happen. When marketing and sales have conflicting views on lead quality, bring it back to the data. Pull up the MQL-to-SQL conversion rate dashboard in Salesforce. Show win rates broken down by lead source. Use facts to mediate opinions and push the discussion toward fixing the process, not assigning blame.
A great facilitator ensures every key stakeholder contributes. If one leader is dominating the conversation or another is silent, step in. Ask direct questions, like, "From a customer success standpoint, how is this pipeline trend impacting renewal conversations?"
Keep the meeting moving. Avoid getting dragged into granular details that are irrelevant to the entire group. If a topic needs a deeper dive, acknowledge it, park it, and schedule a separate follow-up with only the necessary stakeholders. Your ultimate goal is to leave the room with documented decisions and buy-in from everyone, creating a clear set of priorities that will guide every team's efforts for the next quarter.
Turning QBR Insights into an Actionable Roadmap
The real work of a QBR begins after the meeting ends. A great discussion is just a discussion. Its true value is realized only when those strategic conversations become a tangible, time-bound roadmap that people are accountable for executing.
Without a structured follow-up plan, the energy and alignment you built will evaporate. The slide deck gets archived, teams revert to old habits, and the powerful insights you uncovered are lost. This is where a RevOps leader must step in to translate high-level goals into concrete projects within your tech stack. Every initiative needs a clear owner, a defined scope, and a firm deadline.
From Insight to Implementation
Building the bridge from a QBR discussion to tangible results happens when you connect specific tasks directly to your tech stack. This is how you move from theory to practice.
Consider these common scenarios:
-
The Insight: The QBR data shows your MQL-to-SQL conversion rate has dropped by 15%. Sales leaders argue that lead quality is the culprit.
-
The Action Plan: The Marketing Ops Manager owns a project to overhaul the lead scoring model in HubSpot or Pardot (MCAE). They will collaborate with sales to redefine "high-intent" behaviors, adjust point values, and set a new MQL threshold before leads sync to Salesforce. Deadline: 30 days.
-
The Insight: Your sales cycle for mid-market deals is 12 days longer this quarter. Digging into Sales Cloud data, you see opportunities are stalling in the "Proposal/Negotiation" stage.
-
The Action Plan: The Sales Ops leader is tasked with optimizing the sales process in Salesforce. This could involve creating automated follow-up tasks, building new approval workflows for discounts, or developing email templates to handle common objections at that stage.
-
The Insight: A specific marketing campaign had a surprisingly high win rate, but the volume was low.
-
The Action Plan: The demand generation team is assigned a follow-up campaign. They will use the customer profile from the successful deals to build a new audience segment and replicate the effective messaging. All activities will be tracked through Salesforce Campaigns to ensure accurate attribution.
Centralizing Your Action Plan for Momentum
Talking about action items is easy; getting them done is the hard part. A verbal agreement is not enough. You need a centralized system to track progress and maintain momentum throughout the quarter.
Your action roadmap cannot be buried in meeting minutes or a forgotten email thread. It needs to live in a shared, visible space like a project management tool. This builds a culture of transparency and shared accountability, making it clear how each task contributes to the overarching quarterly goals.
Whether you use Asana, a shared dashboard, or a custom object in Salesforce, your system must track these key elements for every initiative:
- The Initiative: A clear description (e.g., "Optimize HubSpot Lead Scoring Model").
- The Owner: The single person responsible for its completion.
- The Deadline: A specific, non-negotiable completion date.
- The Status: A simple way to track progress (e.g., Not Started, In Progress, Completed).
This framework transforms your quarterly business review from a one-time event into the kickoff for a 90-day sprint of focused, strategic execution. It guarantees that every valuable insight is converted into a deliberate action designed to strengthen your revenue engine.
Common QBR Pitfalls and How to Sidestep Them
Even the most meticulously planned quarterly business review can go off the rails. Knowing the common traps ahead of time is key to keeping the session productive and forward-looking. Too often, QBRs get bogged down by data no one trusts or devolve into a departmental blame game. A solid RevOps approach helps you anticipate these issues and guide the team toward collaborative problem-solving.
Getting Lost in Vanity Metrics
This is a classic pitfall. A slide goes up showing a huge spike in website traffic or social media followers. It feels good, but if you can't connect that activity to actual pipeline in Salesforce, it’s just noise.
To avoid this, every metric you present must pass the "so what?" test.
Don't just show the data; explain its impact on the business. Frame your numbers around goals everyone cares about, like Customer Acquisition Cost (CAC) or pipeline velocity. This forces a direct link between top-of-funnel activities in platforms like HubSpot or Pardot (now Account Engagement) and bottom-line results.
- Don't: Flash a slide celebrating 10,000 new marketing leads.
- Do: Show how those leads translated into $500k of new pipeline, even if the total lead volume was lower than last quarter.
That simple shift changes the conversation from "what did we do?" to "what business impact did we have?"
The Blame Game
When a key metric is down, the first instinct can be to point fingers. "Sales never followed up on our leads!" is met with, "Marketing keeps sending us junk MQLs!" This defensive posturing shuts down any hope of collaboration.
As the RevOps leader, you are the neutral facilitator. Your role is to bring everyone back to the data and the process.
When finger-pointing starts, reframe the conversation. It’s not a people problem; it's a process or system problem. Your dashboards are the single source of truth that helps diagnose where the system broke down, not who is to blame.
If MQL-to-SQL conversion is low, pull up the data together. Dig into the lead scoring model. Is a specific campaign driving unqualified traffic? Are leads getting stuck or misrouted in Salesforce? Treat it like a system puzzle the whole team needs to solve, and you’ll keep everyone focused on finding a fix.
Failing to Drive Action
This is the biggest QBR failure: a fantastic discussion that results in… nothing. If everyone leaves and returns to business as usual, you've wasted senior leadership's time. Without clear ownership and deadlines, momentum fizzles out.
Make this a non-negotiable part of your agenda. Block out the last 10-15% of the meeting specifically for defining next steps. For every action item, assign a single action owner—the one person responsible for seeing it through. This creates clear, individual accountability.
Get these action items out of meeting notes and into a shared, visible space like a project board or dedicated Slack channel. Crucially, make reviewing the progress on these exact items the first thing you do at the start of the next QBR.
Got Questions About RevOps QBRs? We’ve Got Answers.
Here are some of the most common questions we hear from sales, marketing, and RevOps leaders who are building a quarterly business review that actually drives results.
How Far Back Should We Start Prepping?
Don't leave this to the last minute. Realistically, you should kick off prep work two to three weeks before the QBR.
That buffer is crucial. It gives your team time to pull, clean, and validate all the necessary data from systems like Salesforce and HubSpot. It also allows for preliminary analysis and time to build a presentation that tells a clear, data-driven story. About a week out, send a pre-read package with key dashboards and major discussion points. This ensures everyone walks in ready for a strategic discussion, not a debate about data accuracy.
Who Absolutely Needs to Be in the Room?
For a QBR to be effective, you need the right people—and only the right people.
Your core attendees must include the heads of Marketing, Sales, and Customer Success. Alongside them, you need the operations leaders who own the data and processes—Marketing Ops, Sales Ops, and of course, RevOps. Most importantly, you need executive sponsorship. A C-level stakeholder, like your CRO or CMO, must be present to approve strategic shifts and new resources. Keep the invite list tight to maintain focus and facilitate firm decisions.
The single biggest mistake is treating the QBR as a purely backward-looking report card. A successful review uses past performance as a diagnostic tool to inform a forward-looking strategy. The conversation must pivot from "what happened?" to "what will we do differently next quarter?"
If you spend the entire meeting just rehashing old numbers, you’ve missed the point. A QBR’s true value isn't in the slide deck; it's in the strategic alignment and the concrete action plan it creates for the next 90 days.
At MarTech Do, we specialize in transforming your QBRs from routine reports into strategic growth engines by unifying your Salesforce and HubSpot data. Explore our RevOps solutions and build a QBR that drives measurable results.